Arlington, Va. – The Aerospace Industries Association (AIA), in collaboration with S&P Global Market Intelligence, today released the 2026 edition of Facts & Figures, highlighting the American aerospace and defense industry’s continued strength and reach across the global economy, including jobs, trade, gross domestic product (GDP), sales, and tax revenue.
“From factory floors to flight decks, the U.S. aerospace and defense industry starts with its people: millions of highly skilled Americans driving innovation, growth, and global competitiveness,” said AIA President and CEO Eric Fanning. “Our industry continues to deliver $1 trillion for the economy, sustained by continuous innovation, a world-class workforce, and strong demand. This year’s Facts and Figures report shows an industry that is a cornerstone of our country’s economic strength and leadership in the global marketplace.”
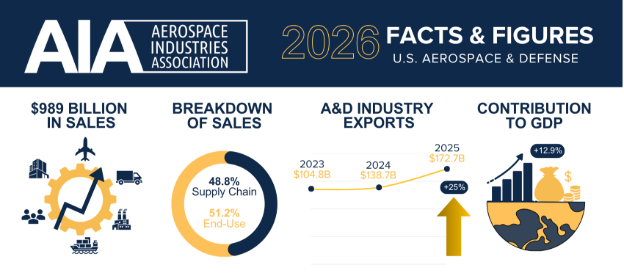
This year’s report, based off the most recent available data, found that the U.S. aerospace and defense industry continues to drive value and global market share, generating $1 trillion in total business activity in 2025.
The industry generated $500 billion in economic value — 1.6 percent of U.S. GDP — and supported more than 2.1 million American jobs. These are high-skill, high-wage roles, with average pay 40 percent above the national average, underscoring the value of the aerospace and defense workforce.
Learn more here.
2026 Facts and Figures Highlights:
Based on 2025 data compiled by S&P Global Market Intelligence
Economic Activity
- The U.S. aerospace and defense industry accounted for 1.6 percent of national GDP in 2025, reinforcing its role as a stable and significant contributor to U.S. economic output.
- The industry generated $988.6 billion in total sales, reflecting the scale of domestic production and sustained global demand across commercial aviation, defense, and space markets.
- This includes $506 billion in direct output and nearly $483 billion in activity across the domestic supply chain.
Workforce/Employment
- The industry supported approximately 2.1 million jobs across every state — sustaining a highly skilled workforce critical to U.S. innovation, manufacturing, and national security.
- Supply chain companies accounted for 1.1 million of those jobs, while end-use companies supported 930,000 jobs.
- Commercial aerospace made up 51 percent of direct industry manufacturing employment, with defense and national security accounting for the remaining 49 percent.
- Aeronautics and aircraft companies were the industry’s largest employer, with 434,000 workers, followed by space (192,000), land and sea systems (170,000), and cyber (117,000).
- Nearly two-thirds of direct employees of aerospace and defense companies have a technical job in manufacturing, engineering, computing, or maintenance and repair.
- Representing almost 2 percent of total U.S. labor income, the industry generated $266 billion in labor income.
- Average industry wages exceeded $127,000, approximately 40 percent above the national average.
- The industry contributed $25.2 billion in state and local taxes, or about 0.9 percent of total state and local taxes nationwide.
- California, Washington, Texas, Florida, and Kansas were the top states for employment supported by aerospace and defense companies, accounting for 44 percent of total nationwide employment by the industry.
- The aerospace and defense industry supported 9,300 establishments across the United States in 2025.
Trade
- U.S. aerospace and defense exports reached $172.7 billion in 2025 — a 25 percent year-over-year increase — signaling strong and accelerating global demand for American aerospace and defense products.
- The industry recorded a $109.2 billion trade surplus, maintaining the largest positive trade balance of any U.S. manufacturing sector and reinforcing its role as a key driver of American competitiveness around the globe.
- The United States’ top export destination countries include China, France, Germany, the United Kingdom, and Brazil. Top import origin countries include Canada, France, the United Kingdom, Germany, and Mexico.
Investment
- The industry invested $45 billion in total capital expenditures — up 13 percent from 2024 — supporting modernization, expanding production capacity, and strengthening long-term competitiveness in an increasingly dynamic global market.
- Original equipment manufacturers (OEMs) and related machinery subsectors accounted for $34.3 billion of these capital expenditures — an increase of nearly $5 billion in investments, or 17 percent, over 2024.
###
