Industry Impact
It’s critical that we routinely examine shifts in industry performance to better understand where A&D stands today. This information helps us identify opportunities on the horizon for our workforce and businesses.
ANNUAL REPORT2025 Facts & Figures: U.S. Aerospace & Defense
Each year, AIA tracks the changes in the U.S. aerospace and defense industry. Among the metrics measured are employment rates, economic output, trade statistics, and state data. Key findings are highlighted here for an at-a-glance view of how the industry fared through the year.
Table of Contents
- State of the Industry
- Creating Jobs
- Supporting the Economy
- Leading Trade Activity
- Tracking State Data
State of the Industry
Driven by robust economic contributions and a commitment to national security, the American aerospace and defense industry continues to set the standard for excellence. In 2024, the industry outpaced national averages in job creation and wages, while playing a pivotal role in global trade, technology leadership, and security efforts. With a world-class workforce, advanced supply chain, and cutting-edge innovations, the sector remains one of the United States’ most vital strategic assets, maintaining leadership in aviation, delivering state-of-the-art equipment to warfighters, and fostering international collaboration with allies and partners.
Note: The 2025 Facts and Figures report reflects the most current data for all years covered. Therefore 2024 and earlier statistics may be different than in previous “Facts and Figures” reports, reflecting updated data sets and the evolution of the industry. For any further questions on methodology, please contact [email protected].
Creating Jobs
AT-A-GLANCE

2.23M Workers

$257B in Compensation

Wages 56% Higher Than Average
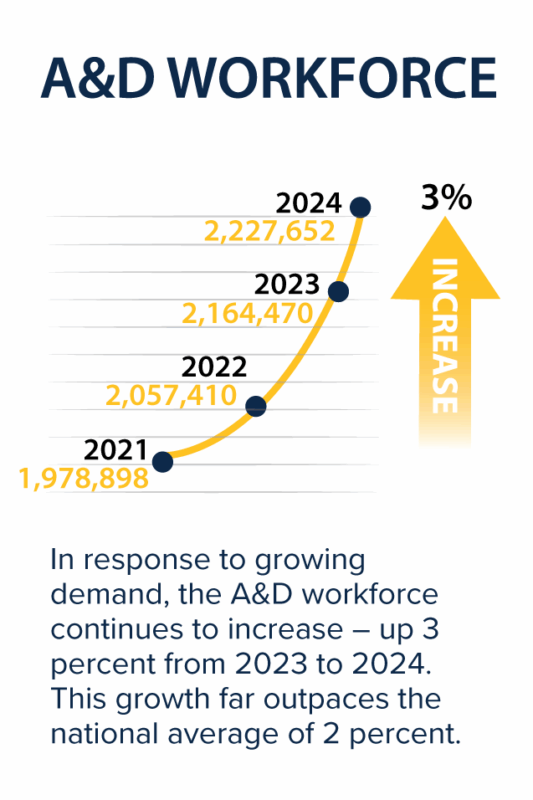
At the heart of the A&D industry is its workforce, powering the recovery of air travel, designing more sustainable aviation technologies, providing cutting-edge defense and deterrence capabilities, and developing the systems that will further space exploration. Despite challenges, the 2024 A&D workforce stood at more than 2.23 million strong, with employees in every state in the U.S. Jobs supported by the A&D industry represent approximately 1.4 percent of the nation’s total employment base. The A&D workforce increased by over 100,000 employees in 2024.
Wages and Benefits 56% Higher Than the National Average
These are highly skilled, good-paying jobs, with an average salary of over $115,000, about 56 percent above the national average. In 2024, the industry paid out $257 billion in compensation.
Supply Chain Employees Account for 59% of A&D Workforce
More than 59 percent of employment comes from the shared A&D supply chain, an extensive network of suppliers composed of thousands of small and medium-sized businesses.
Workforce Makeup by Sector
The majority of the industry’s direct employment is through the defense and national security sector, with a 54 percent share, while commercial aerospace make up the remaining 43 percent.
Across the four subsectors of the A&D industry, aeronautics and aircraft is the largest employer, directly supporting almost 468,000 workers. The land and sea systems subsector is the next largest with about 178,000 workers. Another 156,000 workers represent the space subsector, while about 111,000 are employed in the cyber subsector.
Supporting the Economy
AT-A-GLANCE

1.5% of Total U.S. GDP

$443B in Economic Value

$995B in Total A&D Industry Sales Revenue
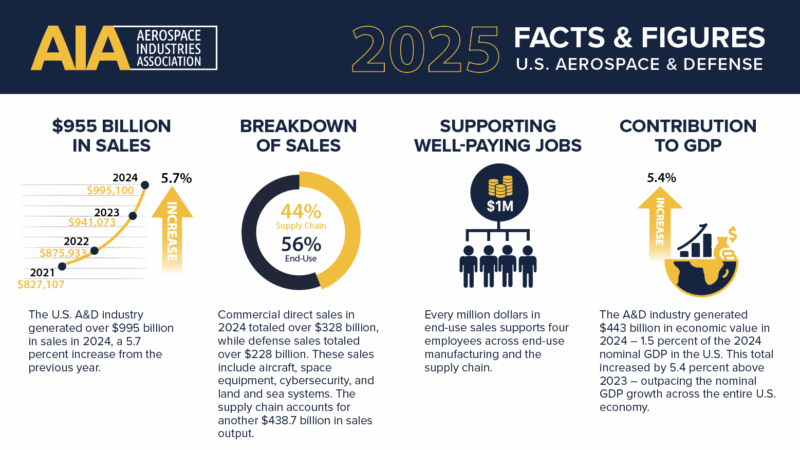
Despite the inflationary pressure and continued supply chain disruptions, the industry’s workforce generated $995 billion in combined sales in 2024, a 4.2% increase from the prior year. This substantial growth emphasizes the industry’s economic influence, with each million dollars in end-use sales supporting four jobs across both end-use manufacturing and the supply chain. Additionally, the A&D industry generated $443 billion in economic value, which represented 1.5 percent of total nominal GDP in the U.S.
Leading Trade Activity
AT-A-GLANCE

$73.9B Trade Balance Value

$138.7B Total Exports
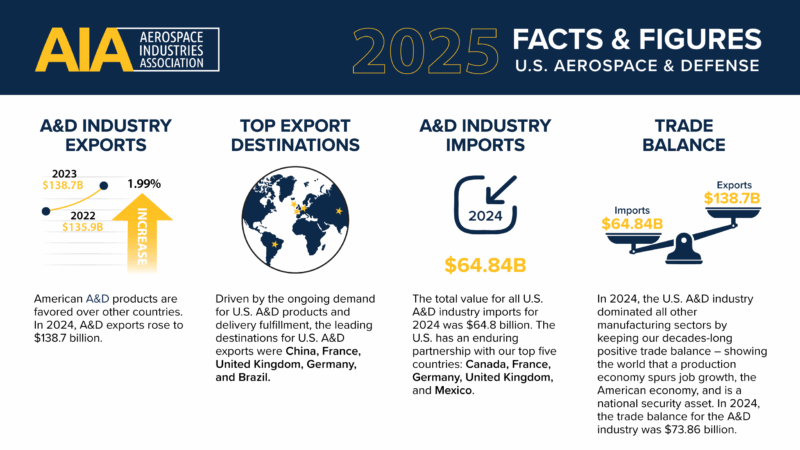
A key component of workforce success is the industry’s global leadership in innovation and the export of aircraft and aerospace products. Driven by global demand for American-made goods, U.S. aerospace and defense exports reached a total value of $138.7 billion from 2023 to 2024.
The Industry’s Top Trade Partners
From sustainable aviation technologies to defense systems, partners around the world trust American companies to provide the best capabilities at the best value. The leading export destinations in 2024 France, Germany, Brazil, China, and the United Kingdom.
The leading import destinations were France, Canada, the United Kingdom, Germany, and Mexico.
Tracking State Data
In 2023, the industry supported jobs and communities in all 50 states and the District of Columbia.
A&D Economy Impact by State
Review the 2023 employment rates, industry revenue, value added, and tax receipts for your state in our annual state data report.
